Snapchat gives users the option to download all their data. This includes information like: saved chats, sent and received snaps, account history, and much more. I plan to run a mock analysis on my chat usage to showcase and expand my skills.
Last updated 10/19/2022
Tech Used:
- SQL
- Python
- Tableau
My Data Adventure:
The Transformation
Snapchat delivers your information in labeled JSON files. JSON is great for storing data but in my case, I first converted them to CSV files. Although Microsoft Server allows JSON, with CSV's I don't have to worry about sub-objects or sub-arrays. To help me, I turned to Python and the Pandas library. The process was pretty simple, consisting of loading and formatting the desired file to be converted. After that, I had some problems converting the formatted file because the original JSON contained nested data. The Pandas library came to my rescue and after flattening the JSON file, I was able to convert the dataframe to CSV.
SQL Shenanigans
Once I was able to import my data to SQL (Microsoft Server), the real work was able to begin. Aside from a class in college and some practice problems, my use of SQL was limited but I had faith and a cheat sheet. The purpose of my first query was to gauge who had sent me the most chats. As of now, Snapchat treats group chats as individuals. This was important to note because I had friends who I only interacted with in group chats, leading to lower individual amounts.
On my second query, I decided to flex my SQL muscles and kick up the complexity of my search. Using a Common Table Expression, I was able to further break down my original query. This time I started by creating my temporary table. My reason for using a CTE as opposed to a subquery was readability. For me, it was easier to keep track of things sequentially as opposed to having a query nested in the middle of my logic.
One of the problems I encountered was my percentages kept appearing as 0. After checking each of my variables individually, I realized the math wasn't wrong. I was simply doing integer division. Everything made sense, of course there isn't an integer between 1 and 0. I casted my tot_received variable as a float and my problems disappeared.
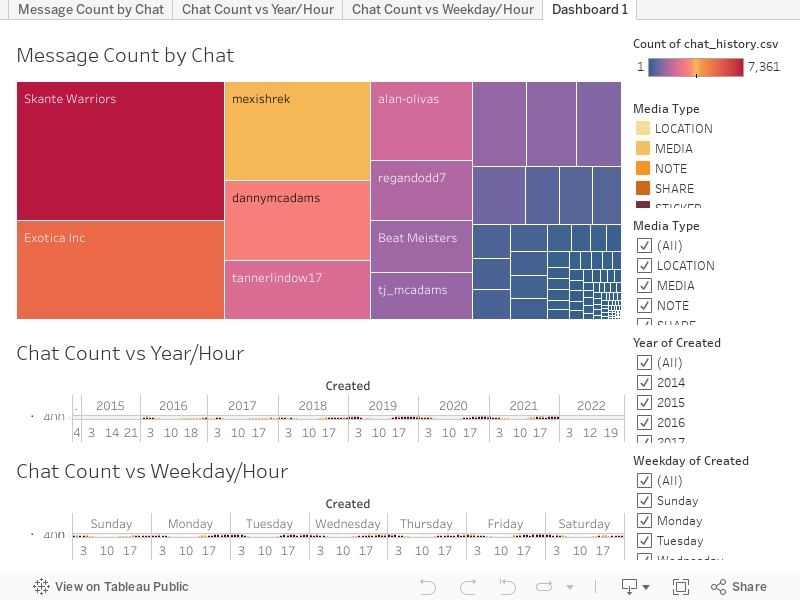
Visualizing My Activity
This part of the process was easily the most shocking for me. Seeing the data represented visually as opposed to numerically made it a lot easier to notice trends. The treemap looked about how I expected; it's the visual equivalent of my first query. What really surprised me was the times at which I would be receiving chats. Across the 8 years I've been using Snapchat, 7am-1pm have consistenly been the lowest points of chats received. Before, I imagined it would've been the opposite, with my highest points being in the middle of the day. Instead, my highest amount of received chats came from the hours of 8pm-3am. This trend continues on a day-to-day basis as well. I thought the weekend would deviate more than it did, but the dip was delayed by only an hour.
Take Aways & Observations
A few things surprised me when I first began looking at my data. There were people I hadn't talked with in a while that I had a lot more contact with than I remembered. There are people I feel I have talked with more than what is shown. I believe that Snapchat was my medium of choice for conversation and the rise in usage over the years can be attributed to my use of group chats. This data was not representative of my relationships because I was looking at them through the vacuum of Snapchat.
Looking at my consistent schedule of receiving Snapchats, I saw an oppurtunity. The pocket of time between 7am-1pm could be my most productive hours. I can come in guns blazing, ready for anything. I tackle any and all problems as soon as they arrive. However by lunch time it looks like my concentration could begin to slip. That could be an area for improvement.
I plan to update my data again at the end of the year, allowing for a complete picture of my 2022 data. How will it compare to years past? Will it surpass them, or will it start to decline? Currently, I believe my usage is on a tumble. More often than not, I was using it to coordinate with friends when we lived together. Now that we've moved away, we don't find as many oppurtunities to talk.